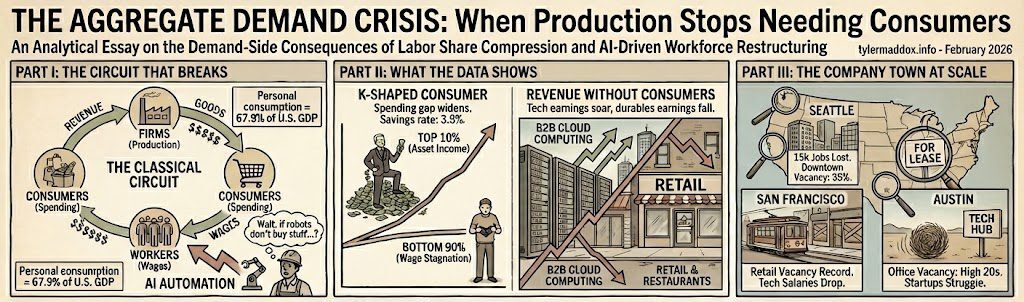
When Production Stops Needing Consumers
An Analytical Essay on the Demand-Side Consequences of Labor Share Compression and AI-Driven Workforce Restructuring
tylermaddox.info February 2026
Research compiled from Federal Reserve, BLS, BEA, Census Bureau, academic research (Acemoglu, Autor, Restrepo), and industry data sources
Part I: The Circuit That Breaks
The existing tylermaddox.info framework has documented the production side of the AI transformation: who works, what gets automated, where labor share goes, what firms spend on AI capital expenditure. This piece fills the structural gap in that analysis. It asks a question that the production-side framework necessarily defers: what happens to the economic circuit when the primary source of consumer demand compresses while output capacity expands?
The question is not hypothetical. It is empirical. And the data, as of February 2026, is beginning to answer it.
The Classical Circuit
Consumer capitalism operates on a feedback loop so foundational that economists rarely examine it directly: firms pay wages, workers spend wages on goods and services, that spending becomes firm revenue, and revenue funds the next cycle of wages. Personal consumption expenditure currently accounts for 67.9% of U.S. GDP (Q3 2025, BEA), elevated above the 65–67% range typical of the 1990–2000 period and near the upper bound of post-2010 levels. The American economy is, by structural design, a consumption economy. It depends on consumers consuming.
But the composition of that consumption has shifted. Only 50% of personal income now derives from wages and salaries (Federal Reserve, 2024). The remaining half comes from employer-paid benefits (11%), business and investment income (28%), and government transfers (18%). This means nearly 40% of the income funding American consumption has no direct connection to labor market participation. For the demand-side thesis, this compositional shift is not reassuring—it is the warning sign. When consumption depends on asset appreciation and transfer payments rather than earned income, it depends on conditions that are inherently less stable than the wage-consumption circuit.
The Compression Mechanism
The AI Capex War documented the budget reallocation mechanism: firms redirect spending from labor to AI infrastructure. Structural Exclusion documented the employment pattern: not mass unemployment, but wage compression and pipeline thinning. The demand-side consequence follows mechanically from these two dynamics.
When firms collectively reduce labor costs through AI-driven optimization, each firm acts rationally. The cost savings are real. The productivity gains may be real. But the aggregate effect operates through a different logic than the individual decision. Daron Acemoglu and Pascual Restrepo have formalized this in their displacement-reinstatement framework: automation has a displacement effect (machines replace workers, reducing labor demand and wages) and a reinstatement effect (cost savings create new tasks where labor has comparative advantage). Their critical finding is that the displacement effect has been accelerating faster than reinstatement for three decades.
Acemoglu’s 2024 paper, “The Simple Macroeconomics of AI” (NBER Working Paper 32487), models the plausible range of AI’s macroeconomic effects and finds them modest—total factor productivity gains on the order of less than one percentage point over a decade, with wage inequality widening as capital captures a disproportionate share of the gains. This is not a prediction of catastrophe. It is a prediction of insufficiency—the productivity gains are real but too small to offset the demand destruction from labor displacement, particularly if the gains accrue to capital rather than labor.
David Autor frames the same dynamic as an “automation-reinstatement race.” His observation that approximately 60% of modern jobs did not exist in 1940 provides historical grounds for optimism about task creation. But his critical caveat is that the evidence now suggests “automation may be pulling ahead” of new task creation, especially in lower-wage occupations. The race is no longer clearly favoring reinstatement.
Part II: What the Data Shows
Where Are the Workers Going?
The BLS reports that 65.7% of long-tenured displaced workers find reemployment. Among those who do, 62% earn as much or more in their new position. This means 38% experience wage loss upon reemployment—and the 34.3% who don’t find jobs at all represent a more severe demand-side loss. These are aggregate figures across all industries; the BLS does not separately break out information technology sector displacement.
What industry data reveals is more granular and more concerning. Challenger, Gray & Christmas reports 154,445 technology sector job cuts in 2025, a 15% increase from 2024. Across all sectors, Challenger tracked over 54,000 job cuts citing AI as the primary reason—a figure that understates the actual displacement, since many firms attribute cuts to “restructuring” or “efficiency” without naming AI explicitly. In the first six weeks of 2026, another 30,700 tech layoffs were announced—on pace to exceed 2025. Meanwhile, planned hires across all employers fell to approximately 508,000 in 2025, the lowest annual total Challenger has recorded since 2010.
The wage bifurcation is where the demand thesis sharpens. Workers with AI skills command a 43% wage premium (PwC Global AI Jobs Barometer) and are seeing 16.7% wage growth. Workers without AI specialization are experiencing the opposite: senior software developers saw 10% year-over-year base compensation declines; mid-level SQL developers saw 7% drops; overall tech salary growth decelerated to just 1.6%. Silicon Valley tech salaries declined 7.3% in 2025.
A software engineer earning $180,000 who becomes a gig worker earning $55,000 is “employed” in the BLS data. They are also a $125,000-per-year reduction in consumer demand. Multiply this across tens of thousands of displaced workers, and the demand destruction becomes material.
The BLS preliminary benchmark revision compounds this picture. The September 2025 estimate showed employment was overstated by 911,000 jobs for the April 2024–March 2025 period. The final figure, expected in the February 2026 jobs report, will likely be lower (the prior cycle’s preliminary estimate of 818,000 was revised down to 589,000), but even a 600,000-job overstatement represents a substantial measurement error in the labor market’s contribution to demand.
The K-Shaped Consumer
The aggregate demand story becomes visible in the consumption data. Bank of America’s Consumer Checkpoint (January 2026) reports total credit and debit card spending per household increased 2.6% year-over-year. But decompose that number by income: higher-income households saw spending grow 2.7% while lower-income households managed only 0.4%. The gap has remained stable for six months.
Wage growth tells the same story. Higher-income household wages grew 3% in December 2025. Lower-income household wages grew 1.1%—the widest gap in more than four years. Moody’s reports that the top 10% of U.S. households now account for 49.7% of all consumer spending, a record since at least 1989.
The personal savings rate has declined to 3.5% (November 2025), well below the 20-year average of 5.9%. The San Francisco Federal Reserve confirmed that excess pandemic-era savings were fully depleted as of March 2024. Consumers are maintaining spending through asset-based income and credit, not through wage growth. Revolving credit is expanding at 7–10% year-over-year while real hourly compensation grew only 0.3% over the prior four quarters.
The Conference Board Consumer Confidence Expectations Index fell to 65.1 in January 2026. A level of 80 or below historically signals a recession within the next year. The index has been below 80 since February 2025. Forty-three percent of workers do not expect any financial improvement in 2026.
Revenue Without Consumers
Consumer discretionary earnings are collapsing. Household durables posted a -27.4% earnings decline for Q4 2025. Textiles, apparel, and luxury goods fell -16.4%. These are among only two S&P 500 sectors reporting year-over-year earnings declines.
The volume-versus-price inversion is the structural tell. In January 2026, NRS retail data showed same-store sales up 4.3% but units sold up only 2.9%—a 1.4 percentage point gap entirely attributable to price increases. Chipotle reported a 2.5% comparable sales decline driven by a 3.2% transaction decline, partially offset by a 0.7% increase in average check size. Forty percent of consumers are cutting restaurant frequency. December retail sales were flat at $735 billion, with core retail volumes rising only 1.4%.
Meanwhile, B2B enterprise revenue accelerates. Cloud computing is projected to grow from $905 billion (2026) to $2.9 trillion by 2034 at 15.7% CAGR. AWS posted its fastest growth in 13 quarters in Q4 2025. The S&P 500 technology sector delivered over 25% earnings growth in 2025. Strip out the Magnificent Seven, and the remaining S&P 493 companies showed revenue growth of just 1.1%. The economy is bifurcating: the firms selling AI tools to other firms are thriving, while the firms that depend on consumers spending are stagnating.
S&P 500 net profit margins stand at 9.75%, fully 67% above the historical average of 5.85%. Revenue growth is 5.2%—and only 1.1% excluding tech giants. This is the signature of a demand-constrained economy where margins expand through cost-cutting (primarily labor) rather than through revenue growth. If demand were healthy, we would see revenue accelerating and margins normalizing as firms invest in capacity. The opposite is occurring.
Part III: The Company Town at Scale
If the demand thesis is correct, it should manifest first and most visibly where tech employment is most concentrated. The data from three major tech metros provides what amounts to a controlled experiment in demand destruction.
Seattle
The Seattle-Bellevue metro area lost approximately 15,000 jobs between August 2024 and August 2025, according to local economic reporting. Amazon and Microsoft account for a substantial share of the area’s tech workforce; since 2023, those two companies alone have shed tens of thousands of workers. The downstream effects, as reported by local media and commercial real estate data, are immediate:
- Restaurant closures: hundreds in the first half of 2025 (local reporting estimates over 400)
- Downtown office vacancy: approaching 35% in Q2 2025 (CoStar/local data)
- Regional office vacancy: 17.3%, projected to peak at 18.3% in 2026
- Job listings: down 35% from February 2020 to October 2025
- Municipal revenue shortfall: $146 million from reduced sales and payroll tax collections
This is the demand circuit breaking at the metropolitan level. Tech layoffs reduce household income. Reduced income reduces spending on restaurants, retail, and services. Service-sector businesses close. Their employees lose income. The cycle continues. Seattle faces a $146 million revenue shortfall—a direct connection to the Fiscal Resilience analysis in the existing framework.
San Francisco
The twenty largest tech employers once leased more than 16 million square feet of office space in San Francisco—nearly a quarter of the city’s total office stock. They now hold 8.3 million square feet. Salesforce alone has shed more than 700,000 square feet since the prior year. The information sector lost 9,300 jobs (-6.6%) in the San Francisco metro area by December 2024, with 16,100 cumulative losses over the prior twelve months.
Retail vacancy hit a record 7.9% in Q1 2024. Major retailers including Whole Foods and Target closed locations. Eighteen percent of Bay Area tech workers reported pay declines in 2024 versus 11% in 2019. Thirty-two percent of tech managers were demoted to individual contributor roles. The city is experiencing demand destruction not through mass unemployment but through wage compression and reduced economic density—precisely the pattern described in Structural Exclusion.
Austin
Austin positioned itself as the lower-cost alternative to the Bay Area. But local reporting indicates tech employment from larger firms declined modestly in 2024 while startup hiring contracted more sharply. Overall office vacancy jumped into the high twenties, with some submarkets like East Austin exceeding 40%. Downtown foot traffic remains well below pre-pandemic levels. Restaurant closures are mounting, with operators citing “slow sales and general affordability” as the primary driver.
If demand suppression were merely a function of Bay Area cost-of-living, Austin should be immune. It is not. The demand destruction follows the income, not the cost structure.
Where Entrepreneurs Are Going
The geographic pattern extends to business formation. Americans filed 5.5 million new business applications in 2023, 37% above pre-pandemic levels (Census Bureau Business Formation Statistics). But the geographic distribution has shifted dramatically. Secondary metros—Indianapolis, Columbus, Sacramento, Phoenix—saw business application growth rates several times the national average, with some reporting year-over-year increases of 100–300% or more. Traditional tech hubs, by contrast, show stabilization or modest decline.
Entrepreneurs are rational demand sensors. They locate where they perceive consumer spending will grow. The dispersal of business formation away from tech metros and toward secondary markets is direct evidence that the people closest to local demand conditions perceive structural weakness in tech-hub economies—not temporary adjustment, but durable demand suppression.
Part IV: The Pattern We Have Seen Before
The 1920s: Credit Bridges a Gap Until It Cannot
Manufacturing output surged 70% from 1922 to 1928. Real wages for factory workers grew approximately 22%—roughly one-third the rate of output growth. By 1928, the top 1% earned 23.9% of pretax income. Approximately 60% of families earned less than the Bureau of Labor Statistics’ minimum for a family of five.
Consumer credit masked the gap. Aggregate consumer installment lending grew at 11.1% annually, from $4.4 billion in 1923 to $8.2 billion in 1929. Over half of automobiles were sold on installment plans. Mortgage debt grew more than 8 times during the decade. The installment plan became the mechanism through which consumption exceeded what wages alone could support.
The structural parallel to the present is striking. Then: 70% output growth, 22% wage growth, consumer credit doubling as a share of income, and a decade-long lag before demand crisis manifested. Now: revolving credit expanding at 7–10% year-over-year, real hourly compensation growing at 0.3%, and a personal savings rate of 3.5%. The 1920s consumption boom sustained itself for approximately eight to ten years before the financial system broke. We are currently five to six years into the current credit expansion cycle.
The 1920s also demonstrate the multi-sector interaction dynamic. Agricultural income collapsed 72.6% between 1920 and 1921. Farm income never recovered to 1918–1919 levels during the decade. Rural demand destruction was masked by urban credit-fueled consumption, creating an appearance of prosperity that concealed structural fragility. The parallels to today’s masking of lower-income demand weakness by top-10% spending are direct.
Deindustrialization: The Rust Belt’s Demand Spiral
Manufacturing employment fell from 19 million in 1979 to 12 million by 2016. The demand-side effects in manufacturing-dependent regions followed a consistent timeline: immediate employment shock, retail closure waves within 3–5 years, housing demand collapse within 4–8 years, service-sector contraction within 8–15 years, and eventual tax base erosion that degraded public services and triggered additional out-migration.
Research examining 1,993 cities across six countries found that only 17% of U.S. manufacturing hubs successfully recovered to prior employment levels, versus 50% in Germany. The American experience was characterized by more persistent demand weakness, suggesting that institutional factors (weaker labor protections, less comprehensive social insurance) amplify demand destruction from structural employment shocks.
Japan: Productivity Without Demand
Japan’s experience is the most directly relevant cautionary case. Labor productivity increased 22.8% over twenty years. Real wages increased only 2.6%. Wages declined approximately 13% from their 1997 peak by 2013—unprecedented among developed nations. The labor share showed a clear downward trend from the 1990s onward.
The mechanism was deflation-driven demand suppression: consumers expected prices to fall further, deferring consumption, which depressed demand and business investment, which reduced job creation, which suppressed wages further. Japan achieved exceptional technological sophistication but failed to translate it into inclusive growth. The parallel to an AI-driven economy where productivity gains accrue to capital while labor share compresses is direct.
The Post-2008 Template
The 2008–2015 recovery established the template for demand suppression during labor market restructuring. Employment turnaround lagged the recession’s end by 21 months on average (versus 4 months in prior recessions). The recovery was characterized by employment polarization: high-wage industries lost 1 million positions while low-wage jobs gained 1.8 million. Lower-wage industries accounted for 44% of employment growth. Meaningful wage growth did not emerge until 2016—six to seven years after the recession ended.
Household deleveraging suppressed demand throughout. Consumers reduced indebtedness by $1.4 trillion from Q3 2008 to Q3 2012, representing a shift from positive cash flows from debt to approximately $500 billion in annual cash flow reduction. Labor force participation fell from 67% (1990s) to 63% (2008–2014), its lowest level since the 1970s.
The consistent finding across all four episodes: 5–9 years from initial productivity-wage divergence to demand crisis manifestation, with credit expansion and savings drawdown bridging the gap temporarily. Japan demonstrates that without structural intervention, the gap can persist for decades.
Part V: The Machine-to-Machine Economy
A dimension of the demand crisis that has no historical precedent is the emergence of economic activity between automated systems. Programmatic advertising now accounts for 92% of U.S. digital display ad spending, exceeding $180 billion. Gartner projects that $15 trillion in B2B purchases will be handled by AI agents by 2028. The M2M services market is projected to reach $312 billion by 2030 at a 24% compound annual growth rate.
This creates a measurement problem. When automated procurement systems negotiate with automated supplier systems, the transaction generates revenue, contributes to GDP, and creates recorded economic activity. But the “consumer” in that transaction is another machine. No human earns a wage from the purchase decision. No human spends the proceeds on rent or groceries. The economic activity is real in the accounting sense but disconnected from the human welfare circuit that traditional demand metrics assume.
Cloud infrastructure revenue illustrates the dynamic. AWS, Azure, and GCP collectively generated approximately $259 billion in IaaS/PaaS revenue in 2025, growing 26% year-over-year. AWS posted $35.6 billion in Q4 2025 alone—its fastest growth in 13 quarters. But only roughly $25 billion of total cloud spending is attributable to AI services, and much of that spending represents inference workloads where the “consumer” is another automated process.
No statistical agency has created an integrated measurement framework for understanding how automated B2B commerce affects welfare-relevant economic metrics separate from aggregate GDP. The BEA has launched a “GDP and Beyond” initiative acknowledging that GDP “ignores the distribution of income and nonmarket goods and services,” but this framework remains in prototype phase. The OECD’s Digital Supply-Use Tables handbook was published in 2023, but adoption by national statistical agencies is in early stages.
The implication is stark: GDP can grow while human welfare stagnates or declines. If a growing share of economic activity flows between automated systems, traditional demand metrics become misleading. Corporate revenue can expand through machine-to-machine commerce even as consumer-funded demand compresses. This does not falsify the demand crisis—it obscures it.
Part VI: What Would Prove This Wrong
Following the tylermaddox.info methodology, this analysis must specify what evidence would falsify the demand-side thesis. Five potential falsification conditions were examined.
Wealth Effects as Demand Substitute
If rising asset prices could permanently substitute for wage growth, the demand thesis would be wrong. Current evidence: the top 10% of households account for 49.7% of consumer spending and hold approximately 87% of corporate equities. Wealth effects currently contribute an estimated 2–5 cents of spending per dollar of wealth increase. The mechanism is real.
But it is not sustainable. Federal Reserve research finds consumers are “ultimately reliant on the health of the labor market, with higher net worth functioning as a complement rather than a supplement to income growth.” The propensity to consume out of wealth is declining over time. A 20% stock market correction could reduce economic growth by a full percentage point. Eighty percent of wealth gains from Q4 2019 through 2023 derived from rising asset prices rather than net savings. Verdict: wealth effects delay but do not falsify the demand thesis.
Government Transfers as Demand Floor
Government transfers currently account for approximately 17–18% of personal income (2022, CRS/BEA), including medical benefits, retirement and disability payments, and income maintenance programs. This share is already elevated—roughly 1.4 percentage points of GDP above pre-pandemic levels—largely because the pandemic-era expansion of transfers never fully unwound.
This is itself an important data point: the system already tried the transfer expansion route involuntarily during COVID, pushing transfers to historic highs. The result is an economy where transfers are elevated and demand is still K-shaped. If labor share compression displaces an additional 10% of labor income, the transfer system would need to expand by roughly 15–20% beyond its already-elevated level to compensate. No political consensus exists for such expansion. The “missing middle” of middle-income workers displaced by AI lacks targeted support programs—Social Security and Medicare serve the elderly, and means-tested programs serve the poorest. Verdict: transfers provide a modest floor but cannot substitute for wage income at the scale required. The post-pandemic transfer expansion has already been tested and found insufficient.
Alternative Income Sources
The gig and creator economies have grown substantially: 70 million Americans participate in freelance work, generating $1.27 trillion in annual earnings. But the income distribution is severely skewed. Median gig income is $36,500 versus $62,500 for traditional employment—a 42% discount. Over 57% of full-time creators earn below the U.S. living wage. Only 4–10% of creators earn above $100,000.
A displaced software engineer earning $150,000 who transitions to gig work at $36,500 is a $113,500 annual reduction in consumer demand. At scale, the gig economy does not replace demand—it represents demand destruction with an employment label. Verdict: alternative income sources strongly reinforce rather than falsify the demand thesis.
The Strongest Optimistic Case
The strongest academic argument against the demand thesis rests on historical precedent: labor productivity has more than quadrupled in the post-WWII period while employment nearly tripled. Cross-sector productivity effects create consumption growth and labor demand. The IMF and OECD research identifies three transmission channels: wage effects (AI complements human labor), income effects (productivity surges boost total income), and consumption effects (higher income creates higher demand).
The critical limitation is conditionality. The optimistic scenario requires that income channels to wage earners rather than being retained as capital returns. The IMF’s own research warns that “AI will likely worsen overall inequality.” The finding that wage levels—not capital costs—drive AI adoption suggests firms are substituting labor, not complementing it. The optimistic academic literature is primarily supply-focused; it addresses whether productivity will rise and whether jobs will be created, but it does not rigorously model whether consumer demand will match productivity growth. Verdict: the optimistic case provides conditional reassurance but does not address the demand-side feedback loop directly. It is agnosticism disguised as optimism.
Part VII: What to Watch
If the demand thesis is correct, leading indicators should emerge before a full crisis manifests. Five categories of indicators are already showing signal.
Consumer Credit Stress
Credit card delinquencies reached their highest level in five years as of January 2025. Average utility arrears climbed from $597 in 2022 to $789 by June 2025—a 32% increase, with nearly 1 in 20 U.S. households carrying utility debt severe enough for collections. Credit card originations declined 19% from 2022 to 2024. Consumers have shifted from revolving to installment credit, with non-revolving credit growing 3x faster than revolving. These signals—particularly utility arrears—typically precede demand contraction by 6–9 months.
Payment Processor Data
Visa and Mastercard combined purchase volume grew 6.3% in 2024, but adjusted for inflation, real transaction volume growth was approximately 3.8%—below trend. Average transaction values grew for the first time in two years, indicating fewer but larger transactions (consumers consolidating purchases). Full-service restaurant tipping declined consistently from 14.8% to 14.6%—a reliable real-time confidence indicator. Consumer spending growth decelerated from 5.7% in 2024 to a projected 3.7% in 2025, and 84% of consumers expect to cut spending in the next six months.
The Margin-Revenue Divergence
S&P 500 net profit margins at 9.75% versus revenue growth of 5.2% (1.1% excluding tech) constitutes a 475 basis point spread between margin and revenue growth. This is the structural signature of self-cannibalization: companies are maintaining profitability by cutting costs (labor) rather than growing revenue (demand). If companies were confident in demand recovery, they would invest in hiring and capacity. Instead, they are maximizing margins through headcount reduction. Bank of America projects AI will boost operating margins by 2% over the next five years—through $55 billion in annual cost savings, not revenue acceleration.
Geographic Concentration
The geographic indicators provide the most granular evidence. San Francisco retail vacancy hit record highs. Seattle lost approximately 15,000 jobs in one year and saw hundreds of restaurants close. Austin’s office vacancy climbed into the high twenties. Business formation surged in secondary metros—Indianapolis, Columbus, Phoenix—while stabilizing or declining in tech hubs. The divergence is the signal: entrepreneurs are moving toward demand and away from demand destruction.
Part VIII: The Connective Tissue
This analysis connects to the existing tylermaddox.info framework at every junction.
The AI Capex War documents the mechanism: firms reallocate budgets from labor to AI infrastructure. This essay documents the consequence: that reallocation reduces the aggregate purchasing power those firms depend on for revenue.
Structural Exclusion documents the employment pattern: not mass unemployment, but wage compression and pipeline thinning. This essay documents the demand-side effect: the 38% of displaced workers who accept lower wages, the 43% wage premium that creates a barbell labor market, the 7.3% decline in Silicon Valley tech salaries.
The Burden of Reversal provides historical benchmarks for what reversal requires. This essay adds the demand-side historical record: the 1920s’ eight-to-ten-year lag between productivity-wage divergence and demand crisis, the Rust Belt’s multi-decade decline, Japan’s lost decades, the post-2008 recovery’s six-to-seven-year demand suppression.
Navigating the L.A.C. Economy proposes demand-side solutions—the income floor and dividend proposals. This essay provides the empirical justification: government transfers, already elevated to 17–18% of personal income post-pandemic, cannot substitute for wage compression at scale. Wealth effects are declining in responsiveness, and the gig economy represents demand destruction with an employment label.
Fiscal Resilience documents municipal revenue dependency. This essay explains the cause: Seattle’s $146 million shortfall, San Francisco’s halved office footprint, Austin’s high-twenties office vacancy—all manifestations of the demand circuit breaking at the local level when tech employment concentrates and then contracts.
The aggregate demand piece is the connective tissue. It explains why the fiscal crisis happens, why the municipal backstop is needed, and what the economic endgame looks like if labor share compression continues without demand-side intervention.
Conclusion: The Fallacy of Composition in Real Time
The central question of this essay was: at what point does collective workforce reduction by firms pursuing AI-driven cost optimization undermine the aggregate purchasing power those same firms depend on for revenue?
The answer, based on the evidence assembled here, is that the undermining has begun but has not yet reached crisis levels. The demand circuit is degrading, not broken. The leading indicators—consumer credit stress, payment processor deceleration, the margin-revenue divergence, geographic demand destruction in tech metros—are all consistent with early-stage demand compression. But aggregate consumption continues, sustained by wealth effects concentrated in the top 10%, credit expansion, and the drawdown of pandemic-era reserves that are now depleted.
The historical parallels suggest a timeline. The 1920s productivity-wage divergence persisted for eight to ten years before demand crisis. The post-2008 recovery required six to seven years for wage growth to normalize. We are approximately five to six years into the current AI-driven cycle. If the pattern holds, the demand-side manifestation—visible not in GDP data but in consumer credit failure, geographic economic contraction, and revenue stagnation beneath margin expansion—is approaching.
The falsification conditions are not being met. Wealth effects require continuously rising asset prices. Government transfers are insufficient at current scale. The gig economy replaces $150,000 jobs with $36,500 jobs. The optimistic academic case does not address the demand-side feedback loop. Every mechanism that could sustain demand despite labor share compression is either inadequate, fragile, or both.
The fallacy of composition is not theoretical. It is observable. Each firm that replaces a $180,000 software engineer with an AI system saves money. All firms that do so collectively destroy the consumer demand that funds their revenue. The circuit does not break all at once. It degrades. The degradation is underway.
The question is no longer whether the demand-side feedback loop exists. The question is whether intervention arrives before the circuit breaks completely—or whether we replicate the 1920s pattern of credit-bridged prosperity followed by structural crisis. The leading indicators suggest we have years, not decades. The monitoring framework in this piece is designed to track the answer in real time.
Methodology and Key Sources
This analysis prioritized 2023–2026 data from primary sources. All empirical claims are sourced to Federal Reserve, BLS, BEA, Census Bureau data, corporate earnings reports, or peer-reviewed academic research. Where secondary sources were used, primary data was verified where possible. Conflicting data points were flagged throughout the analysis. Measurement limitations—particularly the BLS benchmark revision and the absence of granular tech-sector displacement data—are noted where relevant.
Primary Data Sources
Federal Reserve: G.19 Consumer Credit, FRED database, Financial Stability Reports, Household Debt and Credit Reports (New York Fed), Wage Growth Tracker (Atlanta Fed)
Bureau of Labor Statistics: Current Employment Statistics, JOLTS, Worker Displacement Survey, Preliminary Benchmark Revisions, Productivity and Costs Reports
Bureau of Economic Analysis: Personal Income and Outlays, GDP and Components, Personal Consumption Expenditure data
Census Bureau: Business Formation Statistics
Industry and Corporate Data
Challenger, Gray & Christmas: Layoff and hiring announcement reports (2024–2026)
Conference Board and University of Michigan: Consumer Confidence and Sentiment indices
Bank of America Institute: Consumer Checkpoint reports (transaction-level spending data)
FactSet and LSEG Lipper Alpha: S&P 500 earnings season updates, sector-level earnings analysis
Robert Half, Indeed Hiring Lab, PwC: Salary guides, AI jobs barometer, hiring trends
Academic Research
Acemoglu, D. and Restrepo, P. “Automation and New Tasks: How Technology Displaces and Reinstates Labor.” Journal of Economic Perspectives, 2019.
Acemoglu, D. “The Simple Macroeconomics of AI.” NBER Working Paper 32487, 2024.
Autor, D. “The Labor Market Impacts of Technological Change.” MIT, 2024.
Moretti, E. et al. “The World’s Rust Belts: Heterogeneous Effects of Deindustrialization.” NBER Working Paper 31948, 2024.
Geographic and Local Economic Data
Commercial real estate reports: CBRE, CoStar, SF Standard, Seattle Times, Puget Sound Business Journal
Local economic reporting: Austin Monitor, CultureMap Austin, GrowSF, Silicon Valley Business Journal
Federal Reserve Bank of Minneapolis: Local economic diversity research (2025)
This essay is part of the research foundation for The Theory of Recursive Displacement — a unified framework examining how AI-driven automation reshapes labor markets, capital flows, governance structures, and human economic agency. Read the full theory for the complete analysis.
Ask questions about this content?
I'm here to help clarify anything